AI Can Search Vast Peptide Spaces—But Prediction Is Not Proof
AI peptide design evidence can show that a model ranks, classifies, or searches peptide candidates efficiently. It cannot, by itself, prove that a candidate binds the intended target, is selective, remains stable in humans, is safe, works clinically, or will survive drug development. Two peer-reviewed October 2026 papers—PepOpt in npj Drug Discovery and a Graphormer framework in Scientific Reports—make that boundary unusually clear.
PepOpt combines structure-aware and sequence-aware representations in interpretable linear models, then uses dynamic programming to search peptide spaces too large to enumerate. The Graphormer represents peptides as graphs and predicts half-life class or value, solvent accessibility, secondary structure, and post-translational modifications, including inputs with cyclic structures and modified or non-natural residues.
Both frameworks could improve candidate triage. Neither paper reports the prospective discovery and clinical validation of a useful peptide medicine.
Quick answer: These models help researchers decide what may be worth testing next. Their outputs remain predictions until the relevant chemistry, biological assays, animal studies, and human research are completed.
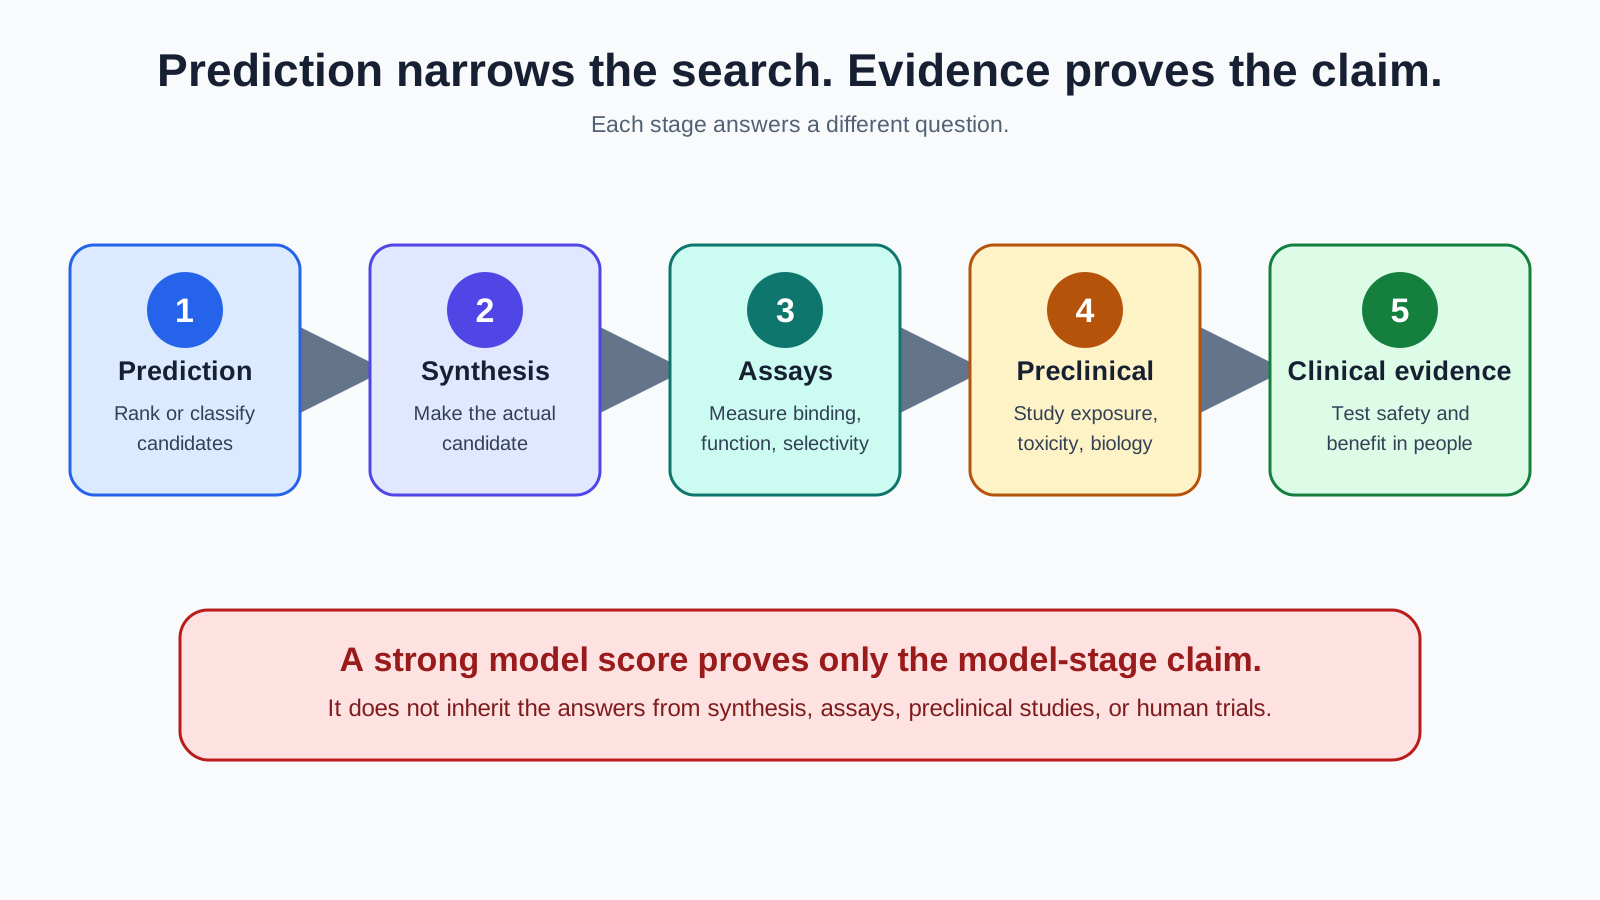
Prediction can narrow the search. Each later evidence stage answers questions the model cannot answer on its own.
What counts as AI peptide design evidence?
The strength of AI peptide design evidence depends on what was predicted, how the data were split, whether the test data were genuinely independent, and what was confirmed experimentally. “AI-designed” is not an evidence level.
At least four evidence buckets should remain separate:
- Retrospective benchmarking: A model is evaluated on historical data, often through cross-validation. This tests whether it can recover known patterns under the chosen split.
- Held-out or time-aware prediction: Test examples are withheld, ideally in a way that resembles future use. This is stronger than evaluating on training data, but it is still a retrospective exercise.
- User-generated experimental data: A model is trained or cross-validated on measurements produced by a company or laboratory. Those measurements are real, but cross-validation within that dataset is not the same as external validation.
- Prospective experimental discovery: The model nominates previously untested candidates, which are then synthesized and tested under a predefined plan. This begins to show whether the model improves real discovery decisions.
Clinical usefulness sits farther downstream. A prospectively confirmed assay hit can still fail on selectivity, exposure, toxicity, manufacturability, efficacy, or trial design.
For a broader introduction to model outputs, see Can AI predict a good peptide drug?. The related guide Why binding is not the same as biological effect explains why even a confirmed binder may not produce the intended function.
What does PepOpt actually do?
PepOpt is an interpretable quantitative structure–activity relationship framework for ranking and optimizing peptides within a defined lead-optimization campaign. It is not a general-purpose clinical success predictor.
The framework represents each residue with position-specific molecular fingerprints. That preserves where a residue appears in the sequence while also encoding chemical substructures, including substructures found in noncanonical amino acids. The preferred implementation used chirality-aware ECFP4 fingerprints with Bayesian ridge regression.
That linear structure has two practical advantages:
- Interpretability: A prediction can be decomposed into residue- and substructure-level contributions.
- Searchability: Because the score is additive, dynamic programming can identify top-scoring sequences without enumerating every complete peptide.
The paper illustrates the scale problem with a 14-residue peptide and a library of about 4,000 candidate monomers: the theoretical space exceeds 1050 sequences. In the reported benchmark, dynamic programming returned the top 1,000 model-ranked sequences from that space in 174.4 seconds on a single CPU core. That is a computational result, not a claim that 1050 physical peptides were made or tested.
How was PepOpt evaluated?
PepOpt was benchmarked on 11 proprietary peptide series from five Merck discovery projects. Series sizes ranged from 415 to 2,013 peptides; the counts in the paper’s Supplementary Table S1 sum to 9,319 records. Peptides were 14 to 17 residues long and included substantial noncanonical-amino-acid diversity.
The authors compared:
- four molecular descriptor families and six linear models;
- one-hot Free–Wilson-style encoding;
- random forest, XGBoost, and radial-basis-function support vector regression;
- CheMeleon, a pretrained molecular model; and
- Pepland embeddings with a multilayer perceptron.
They used three evaluation schemes:
- Five-fold random cross-validation randomly divided each series.
- Five-fold time split used registration dates but trained on the other four folds, including later as well as earlier records.
- Walk-forward validation trained only on earlier folds and tested on the next chronological fold, making it the closest of the three to future deployment.
The difference matters. PepOpt’s mean R² was 0.74 in random cross-validation, 0.28 in the time split, and 0.16 in walk-forward validation. Pearson correlation fell from 0.86 to 0.67 and 0.61, respectively. The model retained useful ranking signal, but exact potency prediction became much harder under more deployment-like splits.
Evidence check: A strong random-split score can partly reflect similarity between training and test examples. Time-aware results are usually more informative for “what happens next?” claims.
What does the Graphormer framework actually do?
The Graphormer converts a peptide into a graph, with amino acids as nodes and chemical bonds as edges, then produces peptide-level or residue-level predictions. Molecular fingerprints encode each residue, allowing the representation to include modified or non-natural amino acids. Graph connectivity also permits several cyclic topologies, including amide- and disulfide-linked cycles.
The paper evaluates separate models for four tasks:
- Half-life: stable versus unstable classification on a public 635-peptide dataset, plus continuous half-life prediction on 448 company-generated cyclic peptides.
- Relative solvent accessibility: whether each residue is buried or exposed.
- Secondary structure: helix, coil, or strand at the residue level.
- Post-translational modifications: residue-level prediction for several modification types.
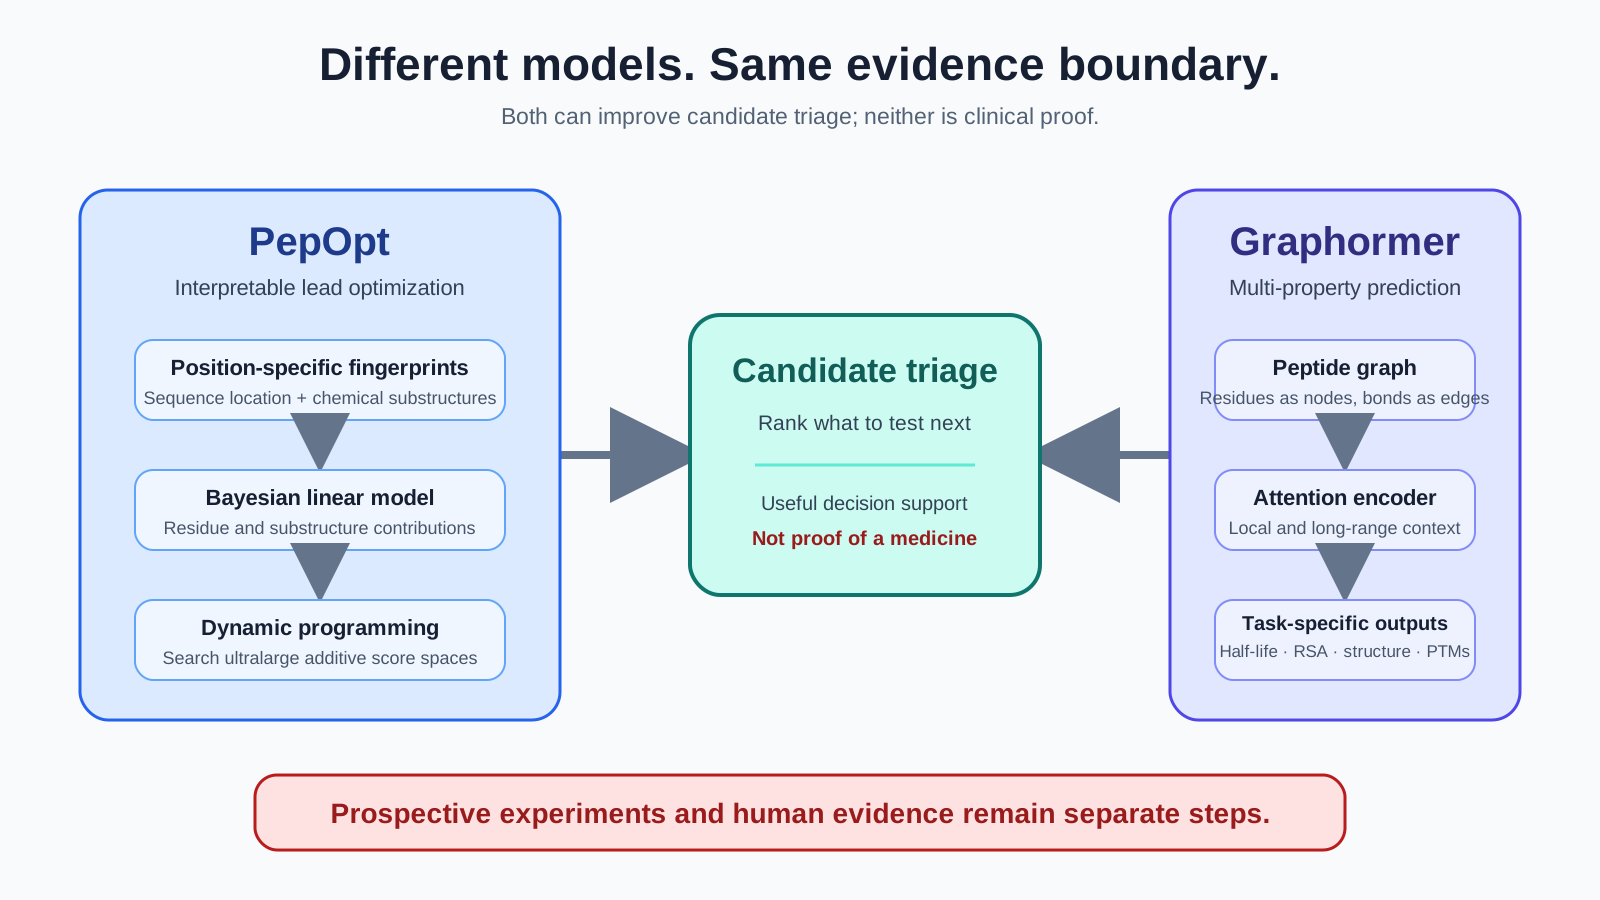
PepOpt and the Graphormer solve different computational problems. Neither skips the need for prospective experimental validation.
How was the Graphormer evaluated?
The paper combines several datasets and split strategies, so its results should not be compressed into one universal “accuracy” number. Each task has a different target, baseline, and validation design.
| Task | Dataset and split | Main baseline | What the result supports |
|---|---|---|---|
| Half-life classification | 635 peptides; same official folds as PepMSND; 10-fold cross-validation | PepMSND | Similar discrimination within that benchmark: Graphormer accuracy 0.844 and AUC-ROC 0.886 |
| Company half-life regression | 448 cyclic peptides with natural and modified residues; 10-fold cross-validation | No external model reported for the same proprietary set | Within-dataset prediction, with mean R² 0.785 and MAE 0.226 log10 minutes |
| Solvent accessibility | Protein training sets of 25,600 and 55,500 sequences; separate 692-sequence 2024 PDB test set | PaleAle 6.0 | Higher recall but lower accuracy and precision than PaleAle on the stated test set |
| PTM prediction | Task-specific train/test sets ranging from 1,504/376 to 142,557/35,673 windows | SAPP | Competitive performance that varies by modification type and specificity threshold |
| Secondary structure | 2,977 training peptides after removing 132 overlaps; 261-peptide benchmark | PEP2D, JPred4, PSIPRED | Competitive distribution prediction; coil was strongest and strand remained difficult |
The overlap audit is an important strength. The authors found that 132 of 261 benchmark peptides—50.6%—were already in PEP2D’s training set. They removed those overlaps before training their Graphormer. Training sets for JPred4 and PSIPRED were unavailable, so overlap with those tools could not be confirmed or excluded.
The six-peptide case study is application-specific, not a discovery trial. It checked predictions for selected, well-characterized peptides and correctly classified the reported half-life category for all six. Selection after outcomes and literature are known can illustrate behavior, but it does not estimate prospective hit rate.
Is company-generated experimental data external validation?
Not automatically. The Graphormer paper’s 448-peptide pharmaceutical dataset is independent of the public PepMSND benchmark, but the reported model was trained and evaluated through 10-fold cross-validation within those 448 records. That is useful internal validation on experimentally measured, project-relevant chemistry. It is not an untouched external cohort evaluated by a frozen model.
A stronger external test would train the final model without access to a separate dataset, lock the model and analysis plan, then evaluate performance once on that untouched set. A stronger prospective test would nominate new peptides before their results were known and compare experimental success against appropriate baselines.
The same distinction applies to PepOpt. Its time and walk-forward splits are more realistic than random cross-validation, and its application examples show how the model could guide choices. But the paper’s top-ranked, previously untested monomers were presented as predictions for later synthesis—not as prospectively confirmed discoveries.
Why interpretability and speed still matter
Interpretability, speed, and benchmark accuracy can improve triage even when they do not prove a drug will work. Discovery teams face far more possible sequences than they can synthesize.
Useful triage can mean:
- ranking a smaller experimental set from a huge theoretical space;
- identifying which residue or substructure drove a score;
- comparing predicted potency with predicted stability-related properties;
- flagging likely buried or exposed residues;
- prioritizing candidates for confirmatory assays; and
- learning where a model repeatedly fails.
PepOpt is especially transparent because its linear coefficients map back to position-specific substructures. The Graphormer is more flexible across graph topologies and prediction tasks, but attention-based representations are not the same as a causal explanation.
Interpretability also has limits. PepOpt’s authors explicitly note that coefficients reflect statistical association, not guaranteed causal effects. The additive model cannot represent every interaction between residues, and a favorable trend can be extrapolated beyond the chemical range where it remains true. The model is most credible when candidate substructures are represented in training data.
What do these papers not prove?
Neither paper proves binding, selectivity, human stability, safety, efficacy, or clinical success for a newly discovered peptide. Those questions require different evidence.
The papers do not establish:
- experimentally measured binding for every top-ranked candidate;
- target selectivity or absence of off-target activity;
- stability, exposure, distribution, or clearance in humans;
- toxicity, immunogenicity, or a therapeutic window;
- efficacy in animals or people;
- reliable performance outside each model’s applicability domain;
- independent prospective replication; or
- that faster candidate search improves the eventual clinical success rate.
Even the predicted endpoints are narrower than the words can sound. A half-life model trained on particular assay conditions does not establish human plasma half-life in every context. A solvent-accessibility model trained largely on proteins is not direct experimental structure determination for a new peptide. A PTM classifier predicts annotations under its dataset definition; it does not prove that a modification occurs in a living human system.
How should readers audit an AI peptide-design paper?
Start with the full paper and supplement, then trace each headline claim to its dataset, split, comparator, and evidence stage. An abstract is too compressed for this job.
Use this checklist:
- Dataset size and composition: How many peptides, targets, assays, species, sequence lengths, cyclic structures, and non-natural residues were included?
- Splits: Was evaluation random, similarity-aware, time-aware, walk-forward, externally held out, or prospective?
- Baselines: Were comparisons run on the same data and split? Did any baseline receive extra inputs?
- Leakage controls: Were duplicates, near-duplicates, shared scaffolds, or benchmark overlaps removed?
- Applicability domain: How chemically and biologically similar is the new candidate to training examples?
- Uncertainty: Are predictions calibrated? Are confidence intervals or per-candidate uncertainty available, or only average metrics?
- External validation: Was a frozen model tested on truly untouched data from another source?
- Prospective experiments: Were new candidates nominated before results were known, synthesized, and tested against predefined criteria?
- Conflicts and funding: Who produced the data, built the model, funded the work, and may benefit from the platform?
- Reproducibility: Are code, model weights, raw data, exact splits, and preprocessing available?
For a general evidence ladder, see what preclinical evidence actually means and how to evaluate peptide claims online.
What are the reproducibility and disclosure limits here?
PepOpt offers public code and an example patent-derived dataset, but its central benchmarks rely on proprietary project data that cannot be independently reproduced from the paper. The paper reports no research funding and declares no competing interests. Its authors are affiliated with Merck, with one author also affiliated with Texas Tech University.
The Graphormer paper provides large benchmark files and documented split resources in its supplement. However, the retrieved supplement does not visibly include the 448-peptide pharmaceutical half-life dataset, and the paper does not provide a separate code-availability statement or repository for this implementation. That limits independent reproduction of the most application-specific result.
The Graphormer work was funded by the Generalitat de Catalunya and Lead Molecular Design S.L. Authors were affiliated with Lead Molecular Design, Merck, universities, and Mass Spec Analytica; the paper declares no competing interests.
Disclosure statements should be reported, not treated as automatic evidence for or against a result. The practical response is to demand transparent methods, realistic splits, independent validation, and reproducible materials wherever possible.
The bottom line
PepOpt and the Graphormer show how computational models can make peptide research more searchable, interpretable, and efficient. They do not turn predictions into proof.
PepOpt’s strongest contribution is an interpretable, additive framework that can rank candidates across enormous noncanonical-amino-acid spaces. The Graphormer’s strongest contribution is a flexible graph representation spanning several peptide-property tasks and structural types. Their benchmarks support candidate triage under defined datasets.
The decisive evidence still comes later: prospective synthesis, appropriately blinded assays, external validation, selectivity and safety studies, and—if a candidate survives—well-designed human trials. AI can make the haystack smaller. It cannot declare the needle a medicine.
FAQ
Can AI design a clinically useful peptide?
AI can generate or rank candidates that may become useful peptides. Clinical usefulness is established only after experimental and clinical validation, not from a model score.
Did PepOpt test 1050 peptides?
No. It searched a mathematical design space with more than 1050 possible sequences under an additive scoring model. The sequences were not physically synthesized and tested.
Was the Graphormer validated on pharmaceutical experimental data?
Yes, in a limited sense: a regression model was evaluated by 10-fold cross-validation on 448 company-generated cyclic-peptide measurements. That is not the same as testing a frozen model on an untouched external or prospective cohort.
Does interpretability prove why a peptide works?
No. PepOpt can attribute a model score to residues and substructures, but the authors note that coefficients represent statistical associations rather than guaranteed causal effects.
What is the most important leakage check?
There is no single universal check. Exact duplicates, close sequence or scaffold analogues, time ordering, shared assays, and overlap with benchmark sets can all inflate performance if they cross the train–test boundary.
Do these models prove a peptide is safe?
No. Neither model directly establishes human toxicity, immunogenicity, drug interactions, or clinical safety.
This article is educational and does not provide medical, treatment, purchasing, investment, synthesis, or model-use advice.
Sources
- Mao Y, et al. “Interpretable machine learning framework for peptide lead optimization in ultralarge design spaces.” npj Drug Discovery. Published October 12, 2026. doi:10.1038/s44386-026-00069-y. The publisher page also links the supplementary information used for series counts, split diagrams, performance tables, and model comparisons.
- Cifuentes P, et al. “A Graphormer approach for predicting peptide half-life, secondary structure, solvent accessibility, and post-translational modifications.” Scientific Reports. Published October 13, 2026. doi:10.1038/s41598-026-75414-2, including the publisher’s supplementary archive.